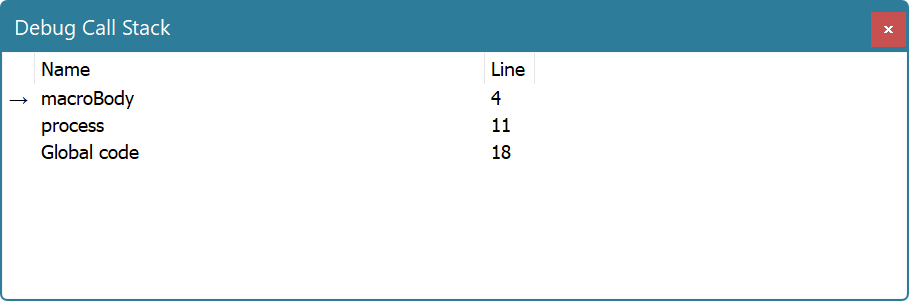
Debug Call Stack Tool Window
When script enters the break state, Call Stack window displays the current execution scope, as well as all parent scoped. You can see the name of the function as well as all function parameters.
Double-clicking on the scope switches the context to this scope. Script window is updated to show you the call site and Debug Watch Tool Window is updated with new scope's locals.
Changing the context does not affect script execution.